As a .Net Fullstack developer with years of experience building enterprise application, transitioning into AI Engineering can feel overwheliming. New tools, new languages, and an entirely different way of thinking about data.
One of the best ways I found to bridge this gap is by working on real-wold data projects.
In this blog, I’ll walk through how I analyzed the Netflix Movie and TV shows dataset using Python and Jupyter notebooks, followig an industry-style AI engineering workflow.
Before We Start
I have created a complete project on Netflix data analysis, which you can find on my GitHub repository. The repo link is available here: https://github.com/spidercode/netflix-data-analysis.
I recommend keeping the project open side by side while reading this blog.
Why EDA (Exploratory Data Analysis) matters in AI Engineering
Before training any machine learning model, an AI engineer must answer a simple question:
Do I really understand the data ?
So EDA helps to answer:
- What does data represent ?
- Is the data clean and usable ?
- Are there trends or patterns worth modeling later?
EDA is the foundation of every successful ML System.
Dataset Overview
- Source: Kaggle – Netflix Moviews and TV Shoes
- Format: CSV
- Content Includes:
- Movies and TV Shows
- Release Year
- Country
- Rating
- Duration
- Type (Movie / TV Show)
This dataset is ideal for beginers because it’s:
- Real World
- Easy to Understand
- Rich enough to extract meaningful insights
Project Structure
Instead of putting everything into one notebook, I followed a clean, scalable structure:
data/
├── raw/
│   └── titles.csv
└── processed/
    └── titles_cleaned.csv

notebooks/
├── 01_eda.ipynb
└── 02_visualization.ipynbWhy this clean structure matters ?
- data cleaning happens once
- avoids code/logic duplication
- visualization consumes cleaned data.
Step 1: Exploratory Data Analysis & Cleaning:
in 01_ead.ipynb, I focused on:
- Inspecting data structure(info(), describe())
- Handling missing value
- Fixing data types
- Creating Derived Feature (e.g. IsMovie)
- Saving a cleaned dataset for reuse.
The output of this step will produce a new csv file : titnes_cleaned.csv
data/processed/titles_cleaned.csvThis file/dataset becomes single source of truth for downstream analysis
Step 2: Visualization & Insights
in 02_visualization.ipynb, I only focused on cleaned dataset – no further manipulation.
Key Visualizations
- Movies vs TV Shows over time
- Netflix content growth since 2000
- Distribution of titles by year
Sample Insight
One of the most interesting findings was the sharp increase in Netflix content after 2015, reflecting Netflix’s global expansion and aggressive content strategy.
Movies consistently outnumber TV shows, but TV shows have been growing steadily over time. See below graph:
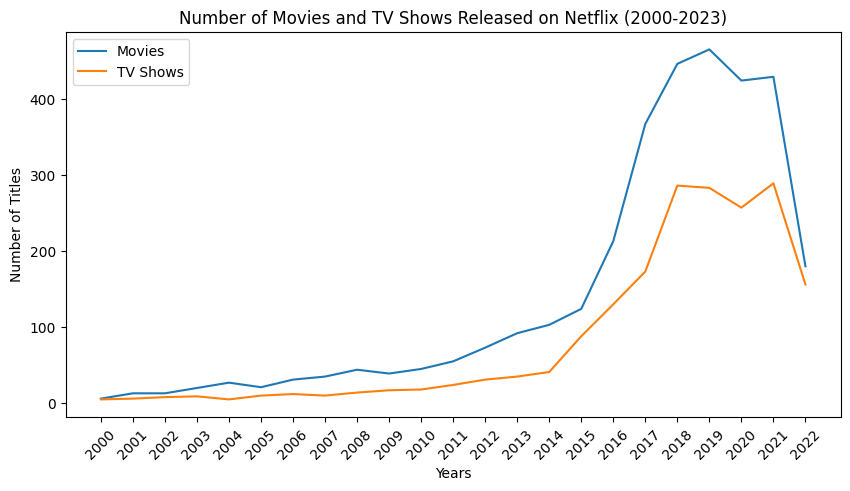
Example: Movies vs TV Shows Over Time
Using Pandas and Matplotlib, I compared how movies and TV shows evolved year by year:
- Clean time-based grouping
- Aligned year indexes
- Clear labeling and legends
Other comparisions I covered : Total Movies vs TV Shows & Top Countries Producing Movies & TV Shows.
This kind of analysis directly feeds into:
- Recommendation systems
- Content strategy decisions
- Forecasting models
AI Engineering Mindset: Thinking Beyond Charts
While this project focused on EDA, it naturally leads to machine learning use cases such as:
- Predicting content type (Movie vs TV Show)
- Popularity forecasting
- Regional content recommendations
- User preference modeling
EDA is where these ideas begin.
Tools & Technologies Used
- Python
- Pandas & NumPy
- Matplotlib
- Jupyter Notebook
- VS Code
- GitHub
Key Takeaways from This Project
- Clean data pipelines matter more than fancy models
- Separating cleaning and visualization improves reproducibility
- EDA is a critical AI engineering skill
- Real datasets accelerate learning far more than tutorials
What’s Next?
This project is the first step in my AI Engineering journey. Next steps include:
- Feature engineering
- Building simple ML models
- Creating ML pipelines
- Deploying models via APIs
You can find the full project on GitHub here: https://github.com/spidercode/netflix-data-analysis
Final Thoughts
If you’re a backend or full-stack developer moving into AI or ML, my advice is simple:
Start with data. Start small. Build real projects.
EDA projects like this one build the mindset required for AI engineering far better than theory alone.
Thanks for reading!